
Siegfried satellite · 2 of 5
Siren - Acoustic Classification Viewer
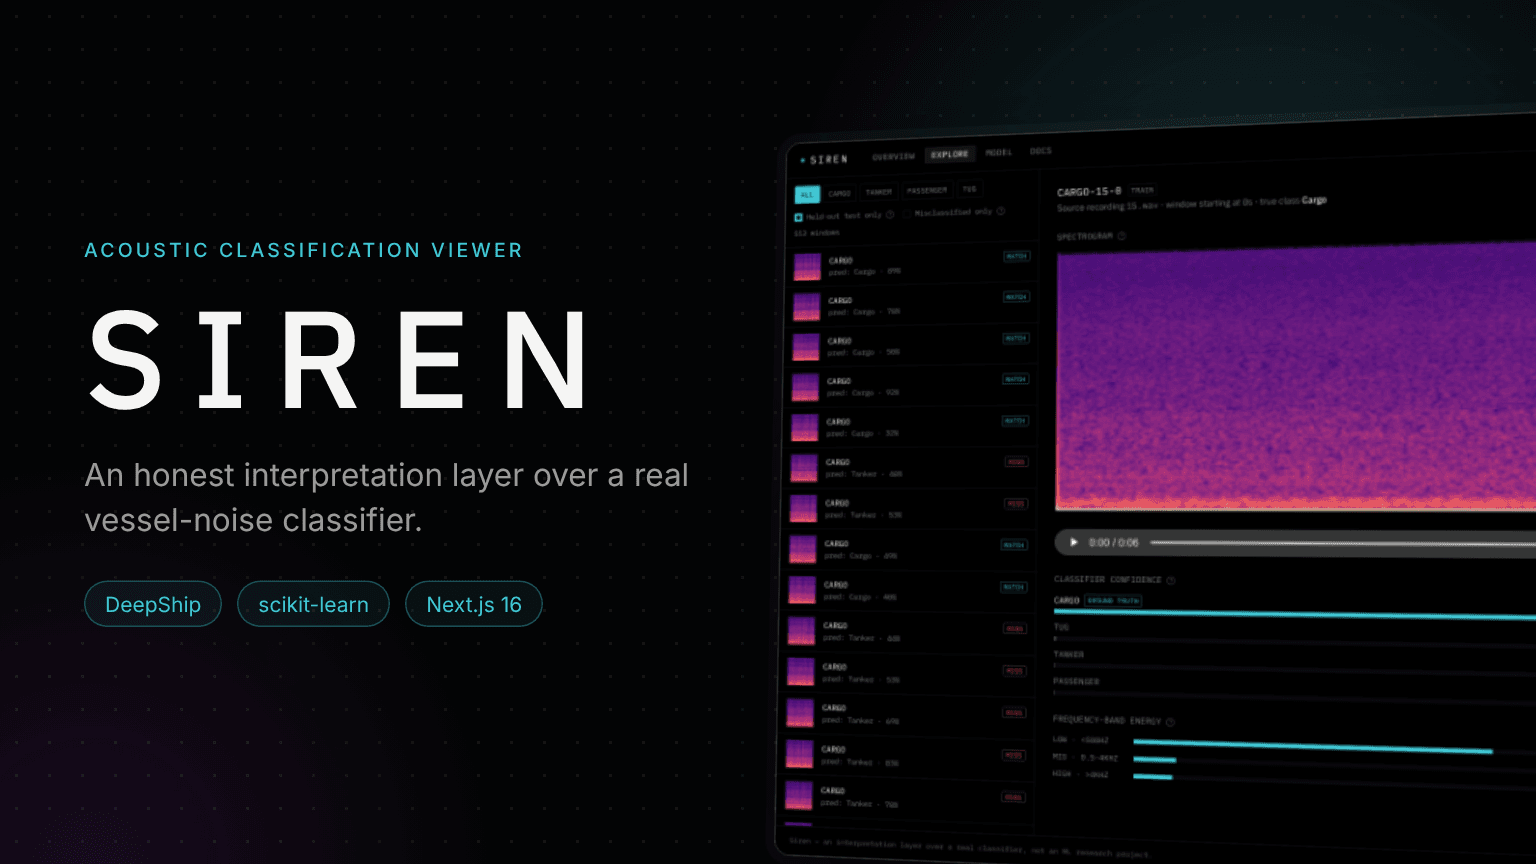
Real recordings of ships, a real and imperfect classifier, and an interface that helps an analyst read each prediction: what the model heard, how sure it was, and where it tends to be wrong.
Role
Design & Development
Stack
Next.js, Python, scikit-learn
Data
DeepShip, 24 recordings
Identity
Cyan · IBM Plex
1. Overview
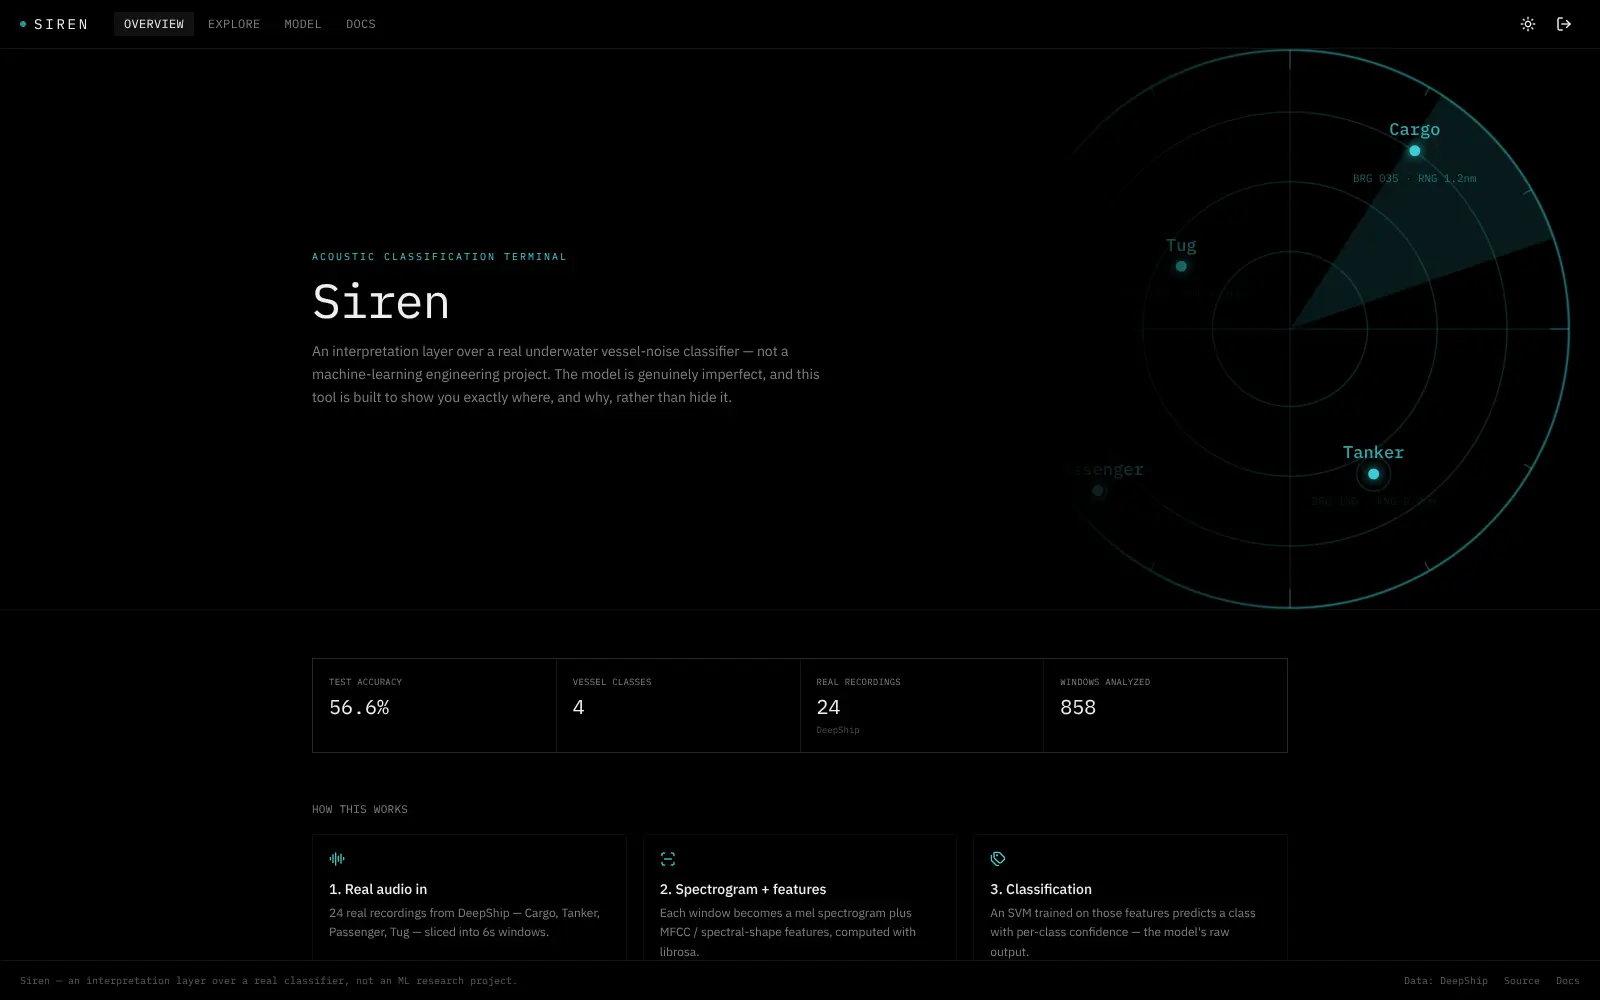
Named for the sirens of myth, known for their song, Siren is about acoustic signatures: the sound a cargo ship, a tanker, a passenger ferry or a tug makes underwater. It is a satellite of Siegfried.
It is deliberately not a machine-learning research project. The model is a small, honest baseline; the work is in the layer on top, which turns a prediction and a confidence score into something a person can check quickly, with its limits on display rather than hidden.
⚠️ The Problem
A classifier's output is a label and a number. Without the evidence behind it, an analyst cannot tell a confident, correct call from a confident, wrong one, and a single accuracy figure hides that one class may never be recognised at all.
✓ The Solution
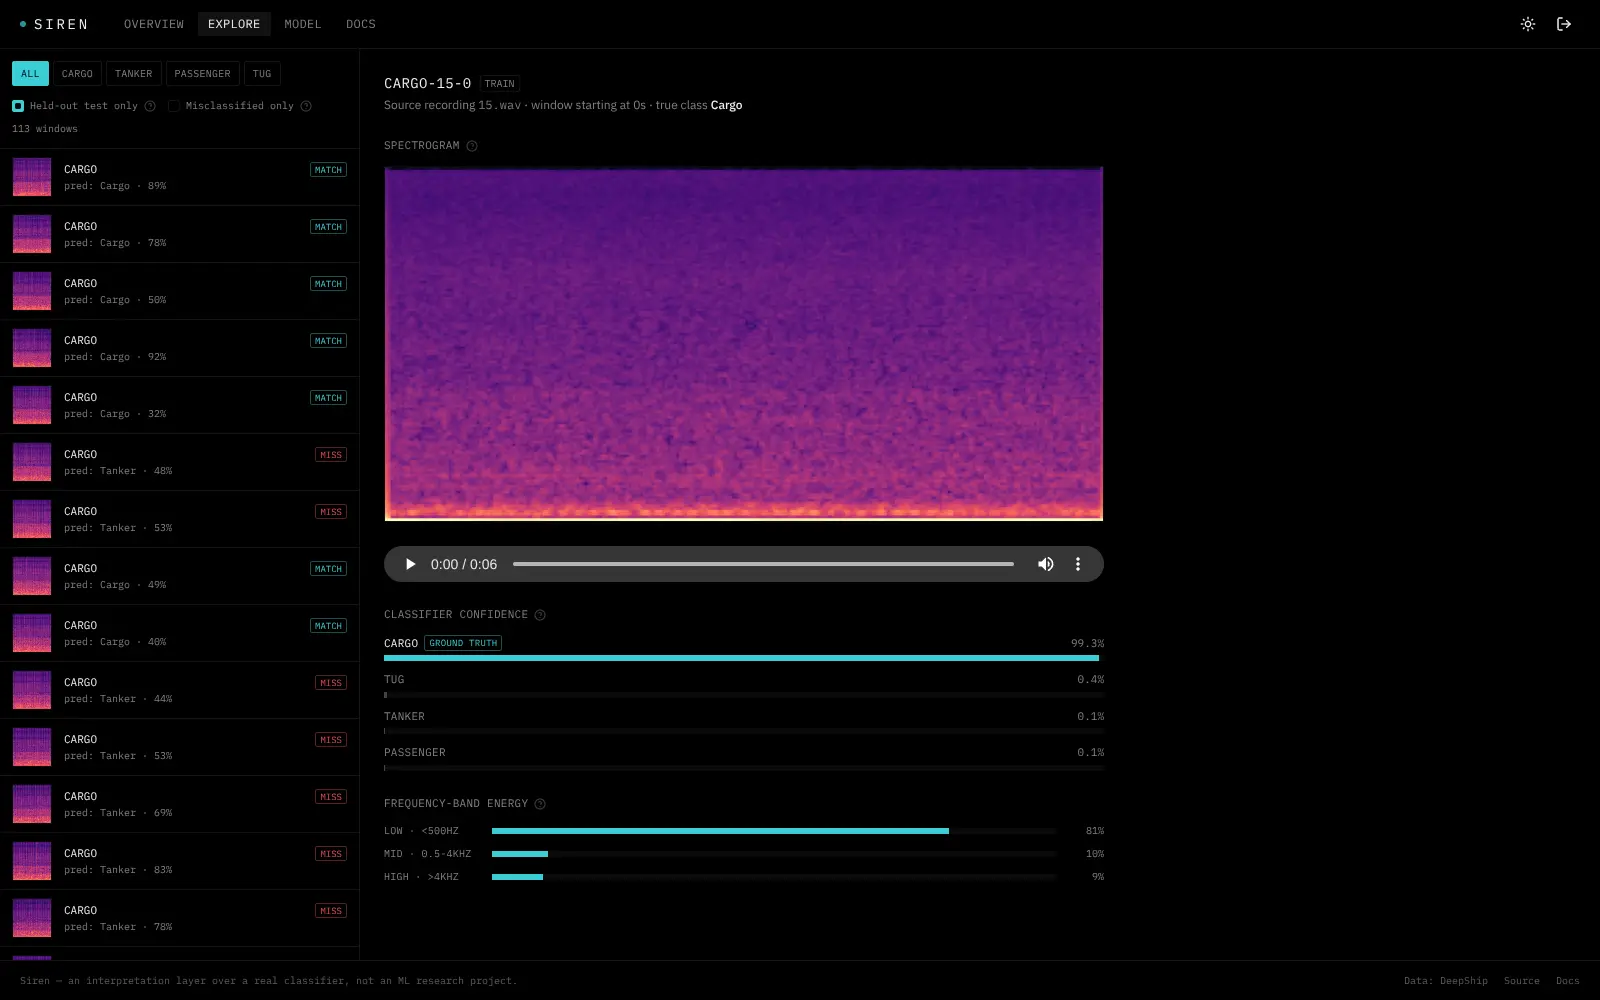
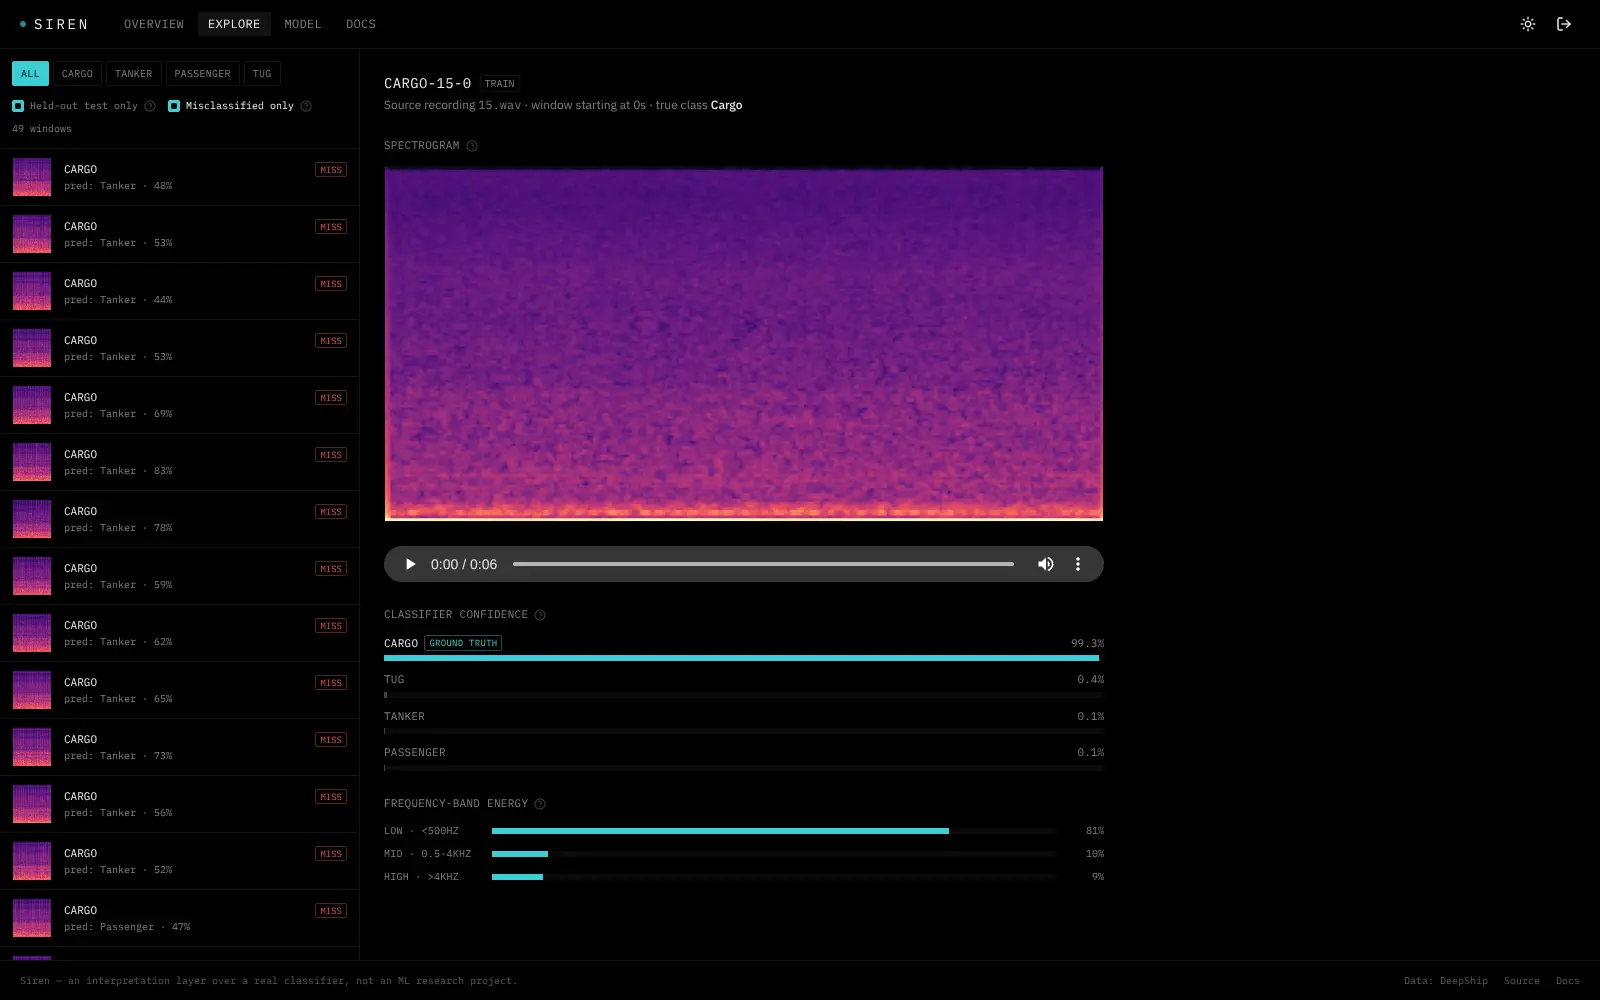
Show the evidence next to the verdict. Every window comes with its spectrogram, a player, confidence for every class and an energy breakdown by frequency band, and a dedicated page reports the real numbers, including the class the model fails on.
2. Real Data, Chosen Carefully
Two public vessel-noise datasets were evaluated. ShipsEar requires requesting access by email, while part of DeepShip, cited in recent papers, can be downloaded directly. Twenty-four recordings were used, six per class, recorded in the Strait of Georgia between 2016 and 2018.
3. The Pipeline
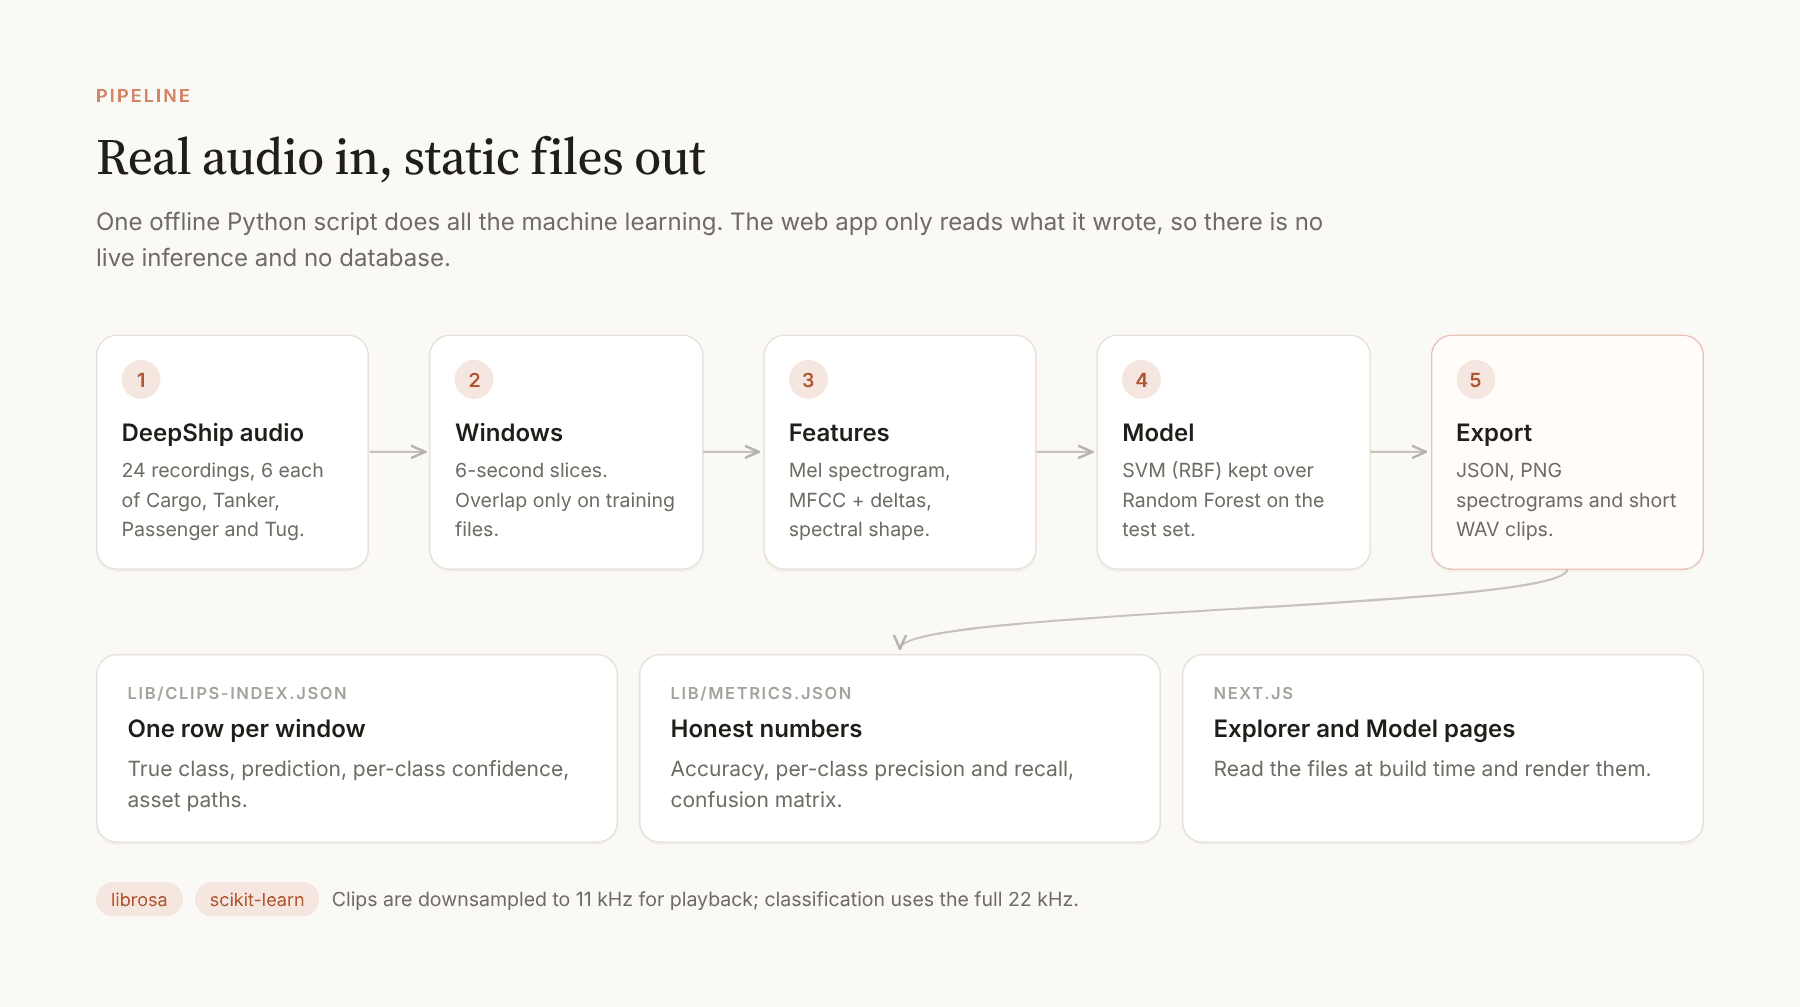
One offline Python script does all the machine learning and writes static files. The web app only reads them, so there is no live inference and no database.
Evaluation that does not cheat
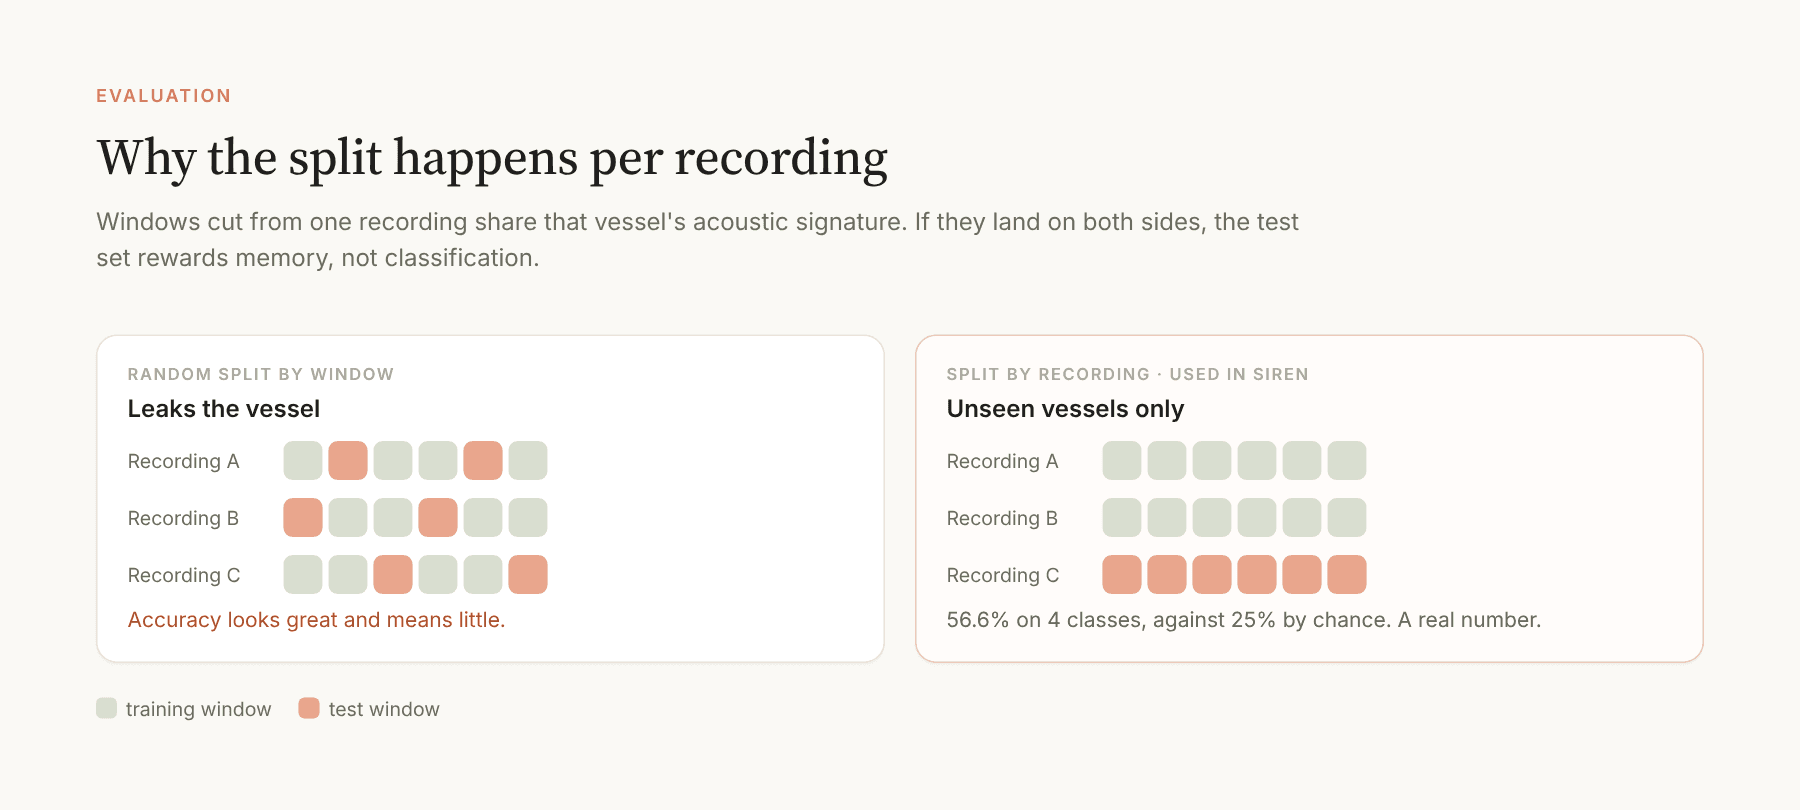
The split is done per recording, not per window. Windows cut from the same recording share that vessel's signature, so a random window split would put the same ship on both sides and inflate the score. Random Forest and an SVM with an RBF kernel were compared on the held-out set, and the SVM was kept.
4. The Explorer
A master-detail view. The list can be filtered by class, to held-out test windows only, or to misclassified windows only, which is the fastest way to see how the model fails.
Spectrogram: A mel spectrogram in the magma colormap, the convention of the field, not a decoration.
Player: The six-second clip, downsampled for the browser while classification used the full rate.
Confidence: One bar per class, with the ground truth marked.
Frequency bands: How the window's energy splits into low, mid and high bands.
5. The Model Page
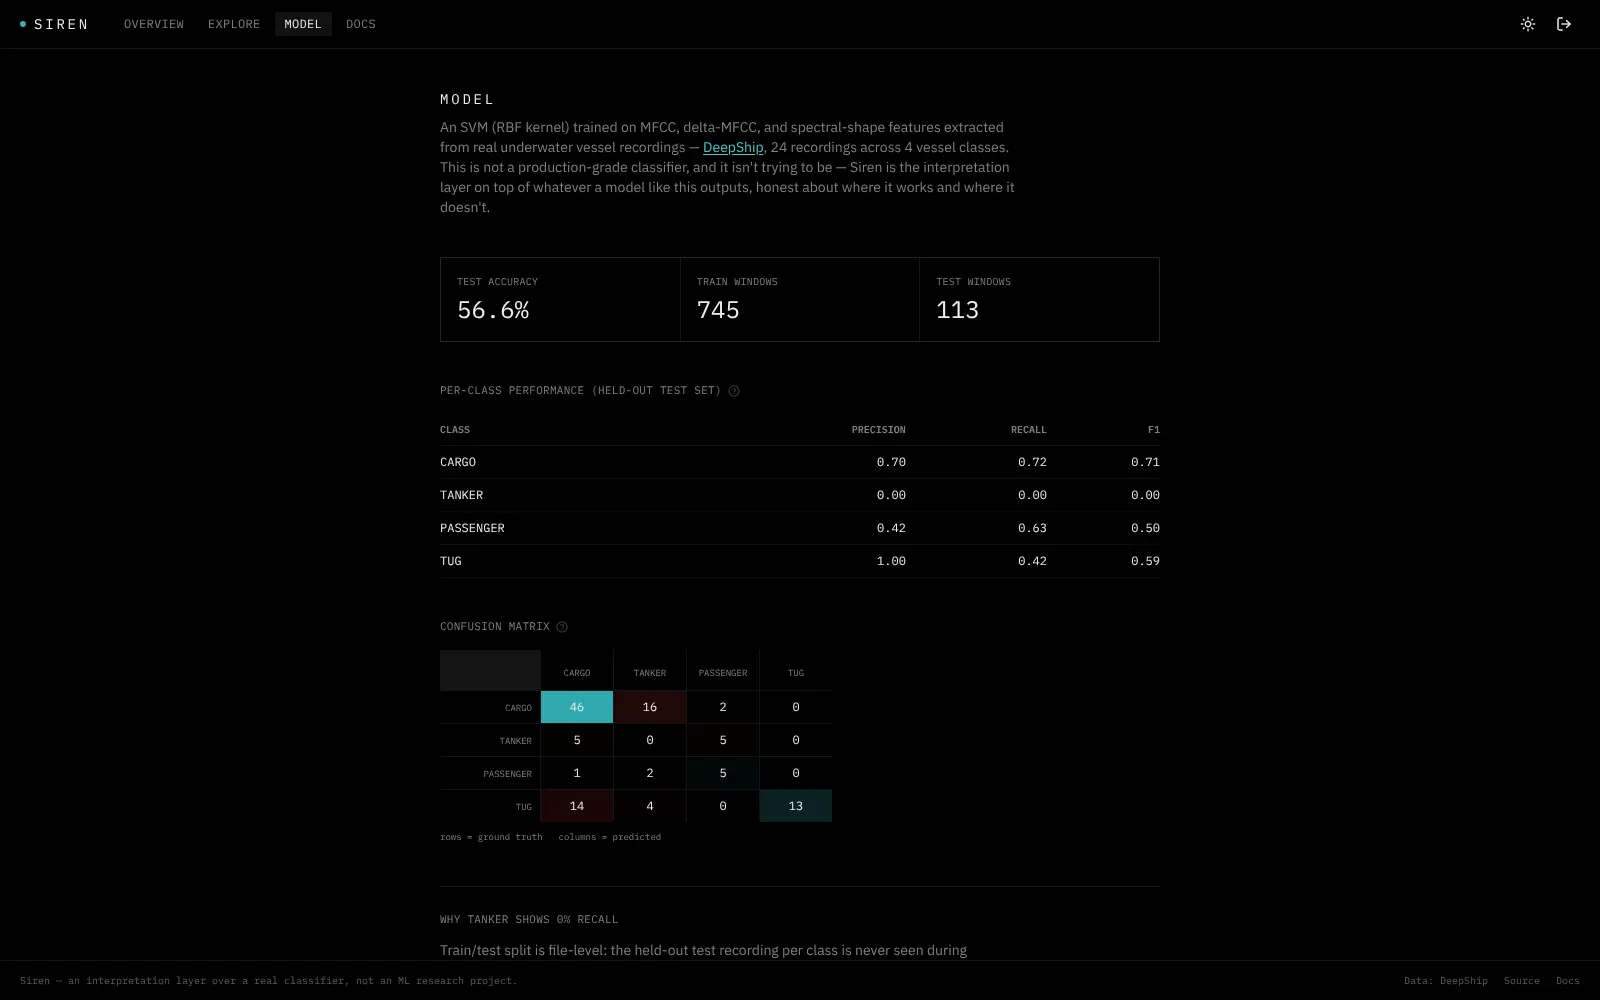
Real numbers, without rounding the bad ones up: 56.6% accuracy on four classes against 25% by chance, a per-class table and a confusion matrix.
| Class | Precision | Recall | F1 |
|---|---|---|---|
| Cargo | 0.70 | 0.72 | 0.71 |
| Tanker | 0.00 | 0.00 | 0.00 |
| Passenger | 0.42 | 0.63 | 0.50 |
| Tug | 1.00 | 0.42 | 0.59 |
Tanker is never recognised, and the page explains why: too little variation between vessels in the training data, not a bug. Leaving that row at zero is part of what the project demonstrates.
6. Identity
Benchmarked against iZotope RX's spectral editor and sonar waterfall displays: a near-black background, a cyan accent kept for functional signals such as confidence and active states, IBM Plex Sans and Mono, and a tight instrument-panel radius.
7. Outcome
24
real recordings
858
windows analysed
56.6%
test accuracy, 4 classes
0
live inference calls
Key Takeaways
- Interpretation is a design problem: Putting evidence next to each prediction did more for trust than a better score would have.
- Evaluate like you mean it: Splitting by recording gave a lower number that actually means something.
- Show the weak spot: A zero in the table, explained, is more credible than a dashboard where everything looks fine.
Next steps: Add more recordings per class, starting with tankers, and compare against a small convolutional model on the same split.